

HealthMapper Visualization
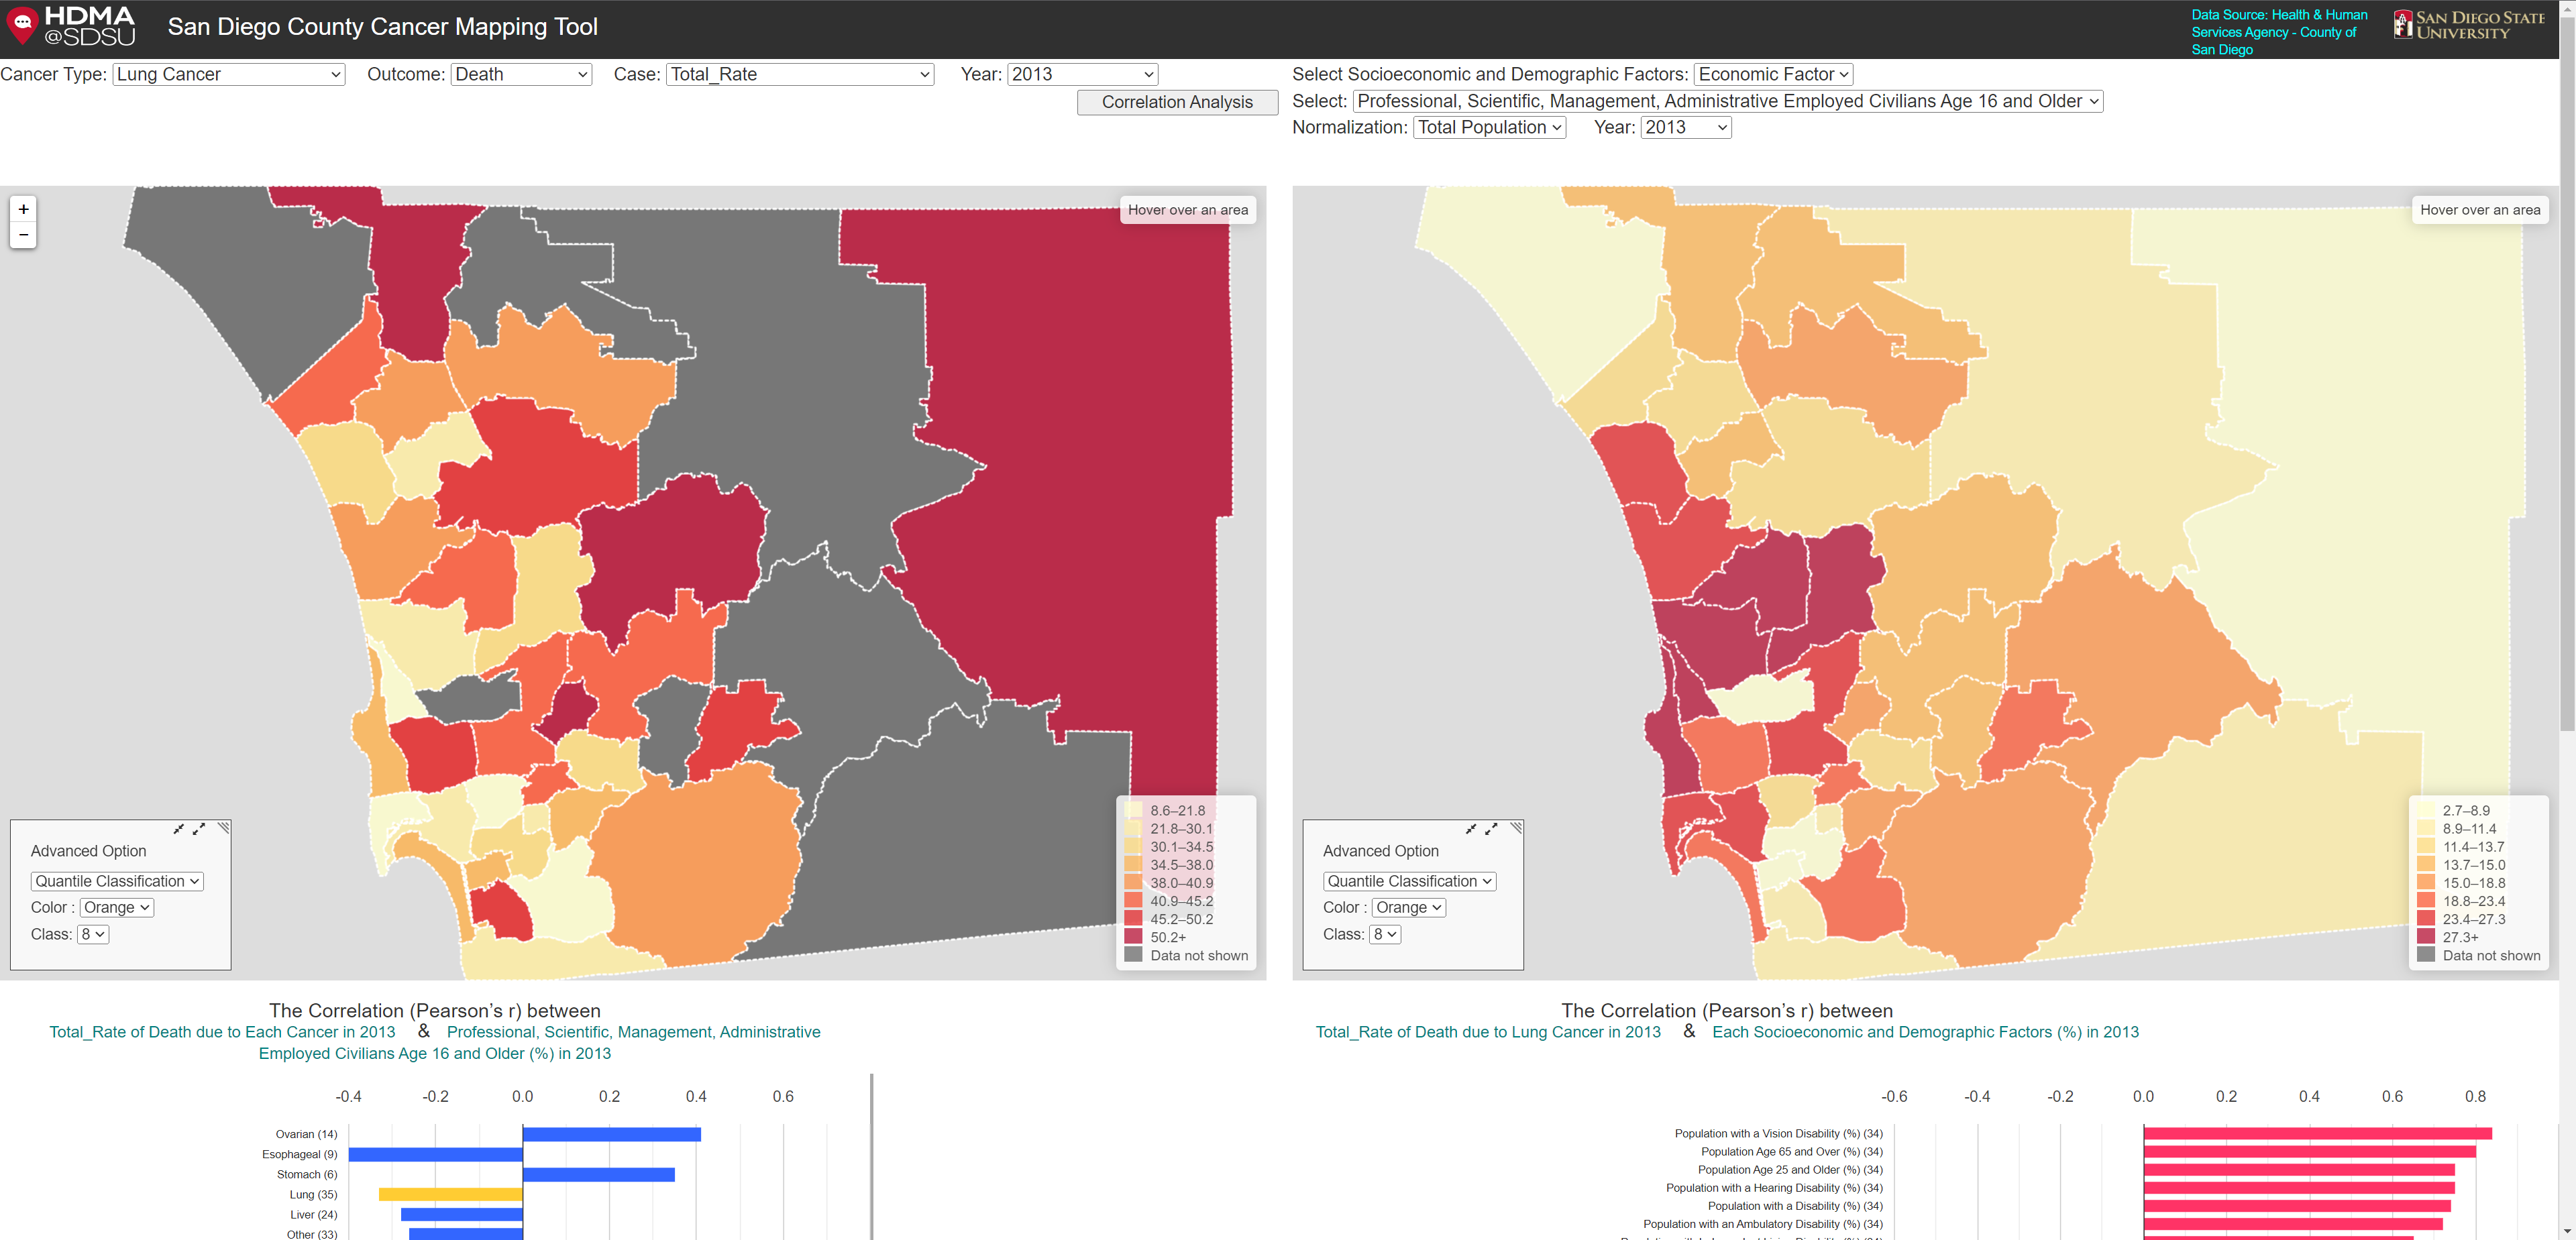
HeathWebMapper aims to develop a highly-interactive and user-friendly Web-based mapping application to visualize mortality and hospitalization data for 19 cancer sites in each Subregional Areas (SRAs) of San Diego County during 2010 to 2013. The application allows users to synchronously explore cancer mortality rates on the left side and socioeconomic and demographic factors on the right side, and help them to explore relationships between cancer outcomes and socioeconomic factors by computing and visualizing spatial and statistical correlations.
HealthWebMapper 1.5 is a new version of HealthWebMapper1.0 developed using Leaflet 1.3.1 with customized Leaflet Cascading Style Sheets (CSS). HealthWebMapper 1.5 keeps the original features in HealthWebMapper 1.0 but includes the following new features: 1) upgrading Leaflet from 0.7.3 to 1.3.1; 2) Layer Control function: base maps (Black&White, Terrain, OpenStreetMap, World Imagery, National Geographic Map) and over layer (Hospitals, Freeways, Moores Cancer Center, Labels). This document will emphasize on the code implementation of the above two new features.